


Family Office
EXCLUSIVE: Europe And North America – Single Family Offices Compared
The extended coverage of single family offices on the database of Highworth Research – an organization working with Family Wealth Report – throws up all kinds of useful data points for people tracking the sector around the world.
This news service, which is exclusive media partner
of Highworth
Research, which has created an online database for single
family offices, was delighted to report that Highworth is
extending its coverage to the North America market. The move can
also help industry figures compare trends in different regions –
an unmatched quality of information.
In this article, Highworth’s founder, Alastair Graham, explains
what the data shows and what conclusions can be drawn from it.
(To register for the Highworth database,
click on this link.)
It might seem reasonable to suppose that single family offices in
North America are, in aggregate, very similar to single family
offices in Europe. After all, UHNW families in both continents
should have similar thoughts about how to manage their financial
assets to achieve both growth and wealth protection over
time.
Of course similarities exist but also there are quite marked
differences. One way to understand the differences is to analyze
the profiles of comparatively large numbers of single family
offices listed online on the Highworth Single Family Offices
Database, both in North America and in Europe, to extract
statistics to compare the SFOs on both continents.
AUM and asset allocation differences
The following table compares SFOs on both continents, currently
575 in North America and 865 in Europe, as profiled on the
database, both in terms of assets under management and asset
allocation. The difference between the total numbers studied
simply reflects a difference in SFO numbers in North America and
in Europe on the database as of today, and these numbers will
become more equal in the coming months.
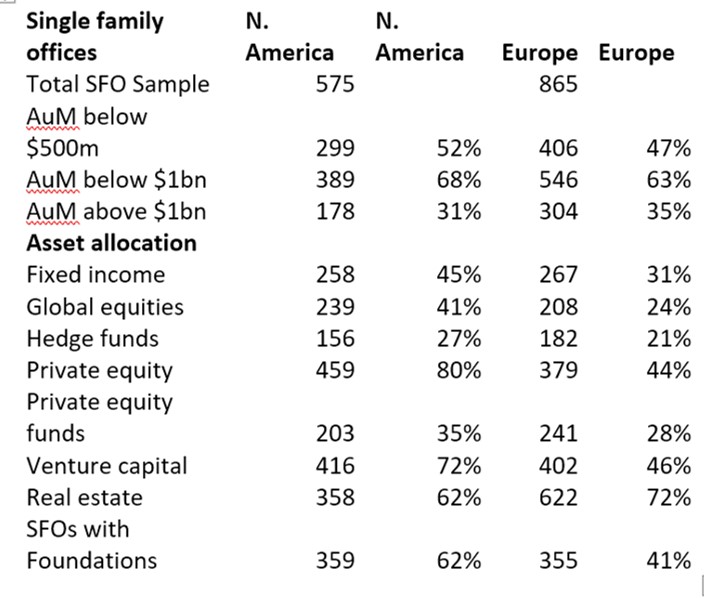
It’s interesting to find that a higher proportion of SFOs in
North America than in Europe have AuM below both $500 million and
$1 billion, and equally interesting that a higher proportion of
SFOs in Europe than in North America have AuM higher than $1
billion.
With asset allocation, the differences are more marked. Note of
course that these numbers don’t reflect percentage allocations
within a portfolio but rather the percentage of SFOs allocating
to that particular asset class. Much higher percentages of SFOs
in North America allocate to the core asset classes and it is
only in real estate investment that European SFOs are more
active.
These numbers don’t have the accuracy of a direct survey of SFOs.
Rather, they reflect the findings of Highworth analysts
objectively researching the investment practices of individual
SFOs from multiple sources. The outcomes should be seen as
indicative rather than precise but even allowing for that, the
differences are striking.
In the case of SFOs with connected foundations in North America
compared with Europe, a comparison of the family foundation
numbers confirms that the philanthropy levels in North America
are markedly different from those in Europe.
Private equity and VC investment differences
Private equity and venture capital investment are even more
aggressively pursued in North America than they are in Europe,
but what of the business sectors in which single family offices
invest in PE and VC on either side of the pond?
The following table, also sourced from the Highworth Family
Offices Database, identifies the family offices which have
invested in each of 15 business sectors in North America and
Europe expressed as a percentage of the total SFO numbers on the
database in each region.

The data shows not only the much more active PE and VC investment activity shown by North American SFOs but also serves as a guide to fundraisers as to which business sectors have been in favor with family offices in the past two years and which have been more in the doldrums.