


Emerging Markets
Emerging Market Debt Is Not Always The Riskiest Asset – J Stern & Co
.jpg)
The independent asset manager explains its approach to emerging market debt, and how assumptions about its riskiness and place in wealth managers' portfolios have changed.
This news service met with Jean-Yves Chereau, a partner and co-portfolio manager at the Emerging Market Debt Stars Fund of J Stern & Co, and Charles Gélinet, co-manager on this fund. Emerging markets are often seen – with reason – as risky, but in fact they’re also starting to be seen as a helpful way of reducing rather than increasing overall portfolio risks.
WealthBriefing: As we head into 2026, with all
the geopolitical noise and drama, what is the firm's broader
approach as it seeks to stay focused on medium to long-term
sources of return? Is there a kind of “J Stern & Co” mindset at
work?
J Stern & Co: To quote Charlie Munger,
"micro is what we do, macro is what we put up with." J Stern
& Co has a long-term, successful track record of managing assets
across economic and market cycles, focusing predominantly on the
quality of the companies we invest in through in-depth
fundamental analysis, whether for equity or fixed-income
investments.
This quality focus combined with a long-term time horizon (10 years for equities and five years for bonds) has allowed us to generate superior returns (+13.5 per cent per annum over the last 10 years for our equities and +8 per cent pa over the past three years for our emerging market debt portfolio) for our investors.
Source: JP Morgan, 31 December 2025
WB: There's been a bit of a shift in recent months, and
indeed over the course of the year, in how emerging markets are
seen on the risk spectrum. What is your opinion and why is it
happening?
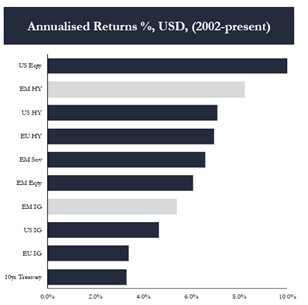
Our multi-asset strategy has consistently had exposure to
emerging market corporate bonds in hard currency, as the asset
class has produced the second-best total returns (+8.5 per cent
pa in US dollar terms) after US equities over the last 23 years
(chart above).
This was done with around 60 per cent of the volatility of the US equity markets. Our analysis demonstrates that allocating 50 per cent of emerging market corporate bonds to an equity portfolio reduces the expected return only marginally but cuts volatility by around 35 per cent (chart below).
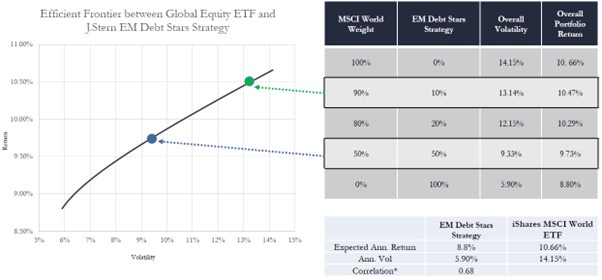
Sources: Bloomberg, J Stern & Co and JP Morgan. As at 31 July 2025 *Correlation has been calculated between iShares EM corporate ETF and iShares MSCI World ETF since 2012
WB: Let's talk about emerging market debt and the
three-year anniversary of the Emerging Market Debt Stars Fund.
What would you say is the main way in which emerging market have
changed?
Growing opportunity
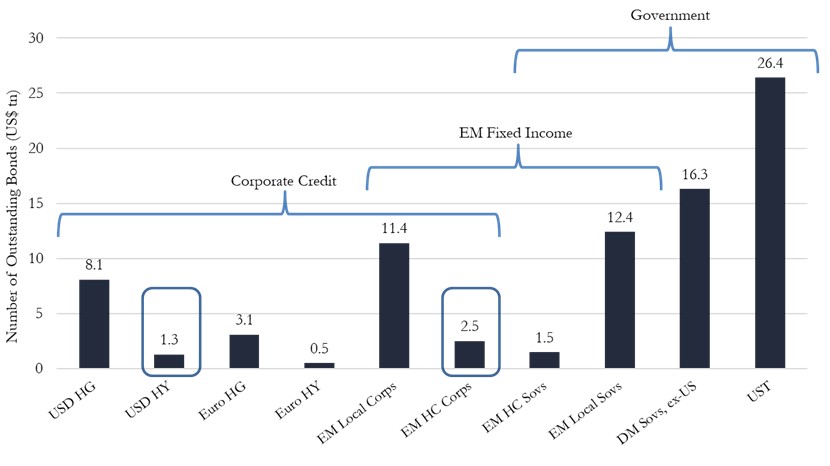
It is important to take a step back first and look at the
emerging market "EM" hard currency corporate asset class over a
longer period. Over the past decade, it has grown by 60 per cent,
with the external bond stock surpassing $2.5 trillion in 2025.
This makes it larger than EM hard-currency sovereigns and almost
twice the size of the US high-yield market.
There has been a 50 per cent increase in the number of bonds available and a 34 per cent increase in the number of issuers. It now boasts more than 1,000 companies in a broad range of sectors in over 60 countries. This provides a plethora of investment opportunities in countries at various stages of the respective economic cycles. This natural diversification is a structural advantage of the asset class.
Source: JP Morgan, 31 December 2024
Quality shining through
From a bottom-up perspective, underlying corporate credit
fundamentals are in good shape. Operating performance and balance
sheet strength are arguably the strongest they have ever been.
Net leverage is near its lowest level post since the 2008 Global
Financial Crisis, with debt maturity profiles comfortable and
default rates below the historical average of 3 per cent.
We generally compare EM corporates with their US peers. From a relative perspective, EM corporates are less levered and maintain over twice the liquidity of their US counterparts. This positions them to defend their businesses and service debt.
This is being reflected in the trajectory of credit ratings. Over the last two years the net rating action has been positive with more credit rating upgrades ($352 billion) than downgrades ($204 billion). There have also been more rising stars than fallen angels, meaning that more companies have transitioned from riskier sub-investment grade to the coveted investment grade status than vice versa.
Supportive macro – higher GDP, lower
inflation
From a top-down perspective, fundamentals also look supportive.
EMs already account for over 50 per cent of global GDP and
contribute approximately 80 per cent of GDP growth. The latest
IMF forecast has global growth for 2026 at 3.3 per cent, with
emerging markets at 4.2 per cent.
This is driven by global capital expenditure and a rebound in commodity exports. At the same time, unemployment and inflation are coming down. EM central banks which have been generally prudent with high real rates, are now in a position to loosen financial conditions if needed.
EM sovereign balance sheets are also healthy. Robust growth, current account surpluses and contained fiscal deficits have limited public debt increases in emerging markets. The average debt GDP is 75 per cent, compared with 112 per cent in the developed world where debt dynamics have deteriorated faster.
WB: How are your clients thinking about EM debt
today?
Since the great repricing of interest rates in 2022, fixed income
has returned to investors' radar. The focus was first on
developed markets, but there is also growing attention on
emerging markets, in particular corporates' hard-currency bonds.
The asset class offers a compelling investment case today, with
all-in yields, low volatility, and diversification benefits.
Yields are a good metric for assessing income and total-return potential. In EM, sub-investment grade yields are around 8 per cent today, which is attractive in absolute terms. It is also interesting relative to similarly rated US issuers which offer around 6.5 per cent. So, investors can get a yield "pick-up" of around 1.5 per cent as companies are being penalised for their postcode, despite all credit metrics pointing to better underlying fundamentals. Interestingly, and perhaps not surprisingly, EM sub-investment-grade has generated more than 8 per cent on an annualised basis over the last two decades, in line with today's starting yields.
The asset class's performance over the "Liberation Day" period highlights an important message. Based on 20 years of VIX data, the relative outperformance of EM hard-currency bonds during periods of intense volatility is significant. In most cases, the drawdown has been less than 40 per cent of that witnessed in US equities, thereby providing downside protection.
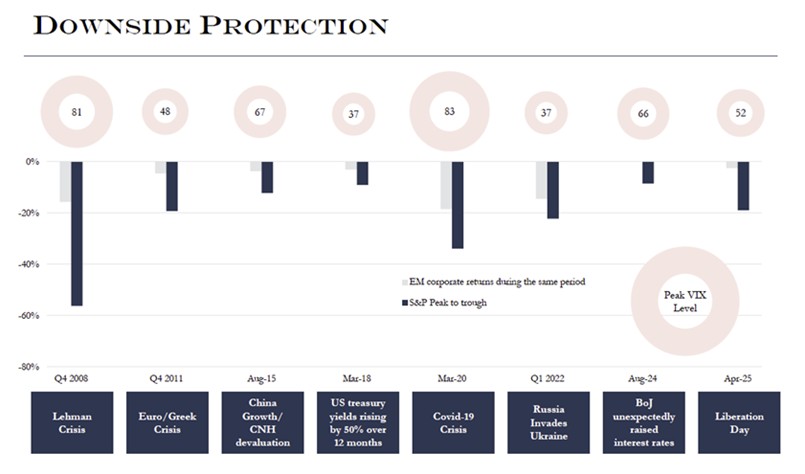
Sources: J Stern & Co; Bloomberg, iShares, 30 June 2025
The benefits of investing in EM credit are becoming more visible to investors. The attractive combination of risk-adjusted returns and diversification has translated into net inflows into the asset class for the first time since 2021. This has come from dedicated EM investors and "cross-over" investors who like the attractive valuations relative to US and euro fixed income assets.
WB: Are there specific types of EM debt (by geography,
class of debt, currency) that you are particularly keen on? Why,
as far as your top holdings go, are they so
significant?
We focus solely on hard-currency bonds, primarily in US dollars,
to mitigate foreign-currency risk. We do not invest in local
currency bonds given the inherent volatility of some EM
currencies. This volatility is often driven by macro events which
are impossible to predict. For the same reason, we do not invest
in sovereign debt.
In addition to a country's economic health, there are inherent political risks that are difficult to analyse. These factors can influence a country's willingness and ability to service its debt.
Perception versus reality
We focus on corporate bonds, which rely for the most part, on the
fundamental strength of the underlying companies. The risks
associated with EM corporates are often perceived as greater than
they are as they are frequently conflated with EM sovereign
debt.
Investors are paid a higher yield for investing in companies based on the country in which they are headquartered, even if they are global companies with diversified sources of revenue and strong fundamentals. This geographic risk premium is often mispriced and part of the opportunity we see.
The objective of our fund is to generate attractive risk-adjusted total returns through income yield and capital appreciation. The fund targets low volatility through credit selection and duration management. From a duration standpoint, we prefer shorter-dated bonds, where we take on credit risk we understand. These bonds are less volatile than longer dates ones, which are more influenced by macro dynamics such as the direction of US Treasury yields.
The returns we can generate come primarily from "carry," which is the coupon on the bonds being paid by these companies. We like this visibility on future returns and the income also acts as a volatility buffer.
Credit selection is also key. Not only do we need to choose a company that meets our investment criteria, but we also need to decide where in the capital structure to invest. Our focus is on the safer part of the capital structure, with most investments in either secured or senior unsecured bonds. These securities are generally supported by significant asset value and comfortable debt serviceability. We believe it offers the best combination of downside protection, income yield and upside potential.
WB: Can we talk about a few general investment themes
that are particularly strong right now and explain why that's the
case?
One investment theme we particularly like is communication and
digitalisation. We gain exposure primarily via the telecom
sector. High barriers to entry support it due to infrastructure
requirements as well as a stable demand profile as mobile devices
become an essential part of life. Alongside this, there are
supportive fundamentals driven by population growth, low mobile
penetration rates and increasing data usage across emerging
markets.
We have exposure across the telecom ecosystem. This starts with fibre networks, which transmit vast quantities of data via terrestrial and subsea fibre cables. Then there are tower companies which provide the tower infrastructure and services to host mobile network equipment. Finally, we invest in mobile network operators themselves, which provide communication services to end consumers.
Digitalisation in Africa
Our investments in Africa are a good example of this ecosystem.
Liquid Intelligent Technologies, "Liquid," is a digital
infrastructure company that owns Africa's largest fibre network,
spanning 110,000 kilometres of fibre cables, including
subsea.
This network connects Africa from north to south and east to
west. Liquid provides services to blue-chip companies such as
Microsoft, Meta, Alphabet and Vodacom. The importance and
strategic nature of Liquid's network are evidenced by a recent
equity raise from companies including the US International
Development Finance Corporation, the International Finance
Corporation, and Nvidia. It is estimated that subsea cables in
Africa have fuelled job growth by between 4 and10 per cent over
the past decade and every additional 10 per cent of the
population connected to the internet leads to a 1.4 per cent
growth in GDP.
In the tower sector, we invest in Helios Towers. The company has
a large tower footprint across Africa, with defensive contracts
priced in US dollars and regularly adjusted by consumer price
inflation and local currency exchange rate movements, providing a
buffer against volatility. It has strong organic growth potential
due to increasing mobile penetration and data usage. It also has
inorganic potential due to a significant number of towers still
being held by mobile network operators.
We also invest in MTN Group, the largest mobile network operator in Africa with broad geographic diversity and 288 million subscribers. MTN enables internet access, which is required for people to access essential services such as banking, healthcare, education, and government services, thereby providing a stable demand profile.
WB: Where else have you taken profits and rebalanced in
the fund, and why?
Managing refinancing risk
Key risks include the direction of US interest rates and the
availability of credit. Stickier inflation and labour-market
resilience could lead to slower-than-expected monetary loosening
(or even tightening). This can lead to higher default rates,
particularly among lower-quality issuers.
The effect of tighter financial conditions can be compounded by lower credit availability. Unexpected defaults in the broader corporate sector, particularly in US private credit, with the high-profile bankruptcies of First Brand, have raised questions about whether we are in the later stages of the credit cycle.
As a result, we have limited refinancing risks in the fund. This has been particularly prevalent in the energy sector, given the medium-term direction of oil prices. We have reduced exposure to companies with question marks over their production profiles, high cash costs, and near-term financial liabilities that need addressing.
WB: Where have you taken profits recently, and why, across the board, including the EM fund?
In our multi-asset portfolio we manage the risk constantly.
WB: What's your cash position?
The cash position is slightly higher than usual but still below 5
per cent as we see enough opportunities in our emerging market
bonds universe to deploy capital whilst generating around 7.5 per
cent yield.
WB: With all the talk in the past few years about
concentration risks, the 'Mag7' etc., how do you think about such
concerns, and more to the point, what do you say to
clients?
The "Mag 7" concentration risk is particularly relevant if your
equity exposure is limited to the US market, less so in our case
as our benchmark is the MSCI World for equities. However, it
remains an issue because it increases volatility at the portfolio
level. To maintain relatively low volatility, we have increased
our exposure to emerging market bonds in our multi-asset
portfolio, which, as we have explained, provide equity-like
returns with much lower volatility.
WB: Have you become more tactical in your asset
allocation changes?
We took the conscious decision to reduce the duration of our
portfolio from around 3.5 years to the current level of 2.5
years. Over time, we have maintained the duration below
five years, but, as we view risks as having been rising, we
have adjusted to the environment.
WB: What areas of the investment world, in terms of
potential opportunities, do you see as being unjustly overlooked,
and why when it comes to the EM fund and other
areas?
Not surprisingly, even after three good years of performance, we
still believe that our emerging market corporate debt strategy
offers a unique opportunity with attractive expected returns (8
per cent per annum over the next 2.5 years), a supportive current
yield of 7.5 per cent, and low volatility. Its capacity to
protect downside risk and its diversification characteristics
relative to other asset classes present are, in our view, an
attractive combination in the current uncertain environment.
WB: In terms of the sort of metrics you use to
evaluate companies and opportunities for this fund and for
others, are there ones you put a particular stress on, and
why?
The strength of corporate balance sheet is key. EM corporates are
significantly less levered than their US counterparts and are not
far from the lowest level post the 2008 Global Financial
Crisis.
Net leverage of US corporates
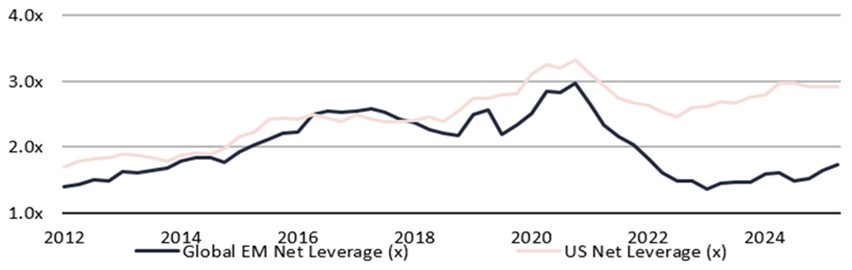
Sources: J Stern & Co, Bank of America; data as of 30 June 2025
EM corporates are also well capitalised, with significant cash holdings. This is more than double the liquidity of US corporates and puts them in a good position to defend their businesses and continue servicing debt.
Liquidity of US and EM corporates
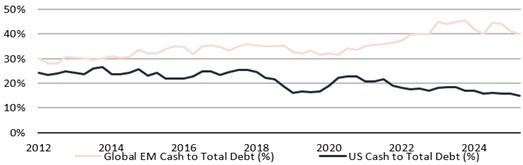
Sources: J Stern & Co; Bank of America as of 30 June 2025
These relative strengths of EM corporates are reflected in the achieved and forecast default rates. EM corporate high yield defaults peaked in 2022-2023, owing to localised exogenous factors in Russia and China's real estate markets, which have now started to subside, allowing default rates to fall to the long-term average of around 3 per cent.
Default rates of US and EM high yield corporates
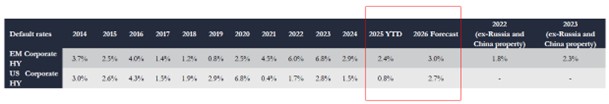
Sources: J Stern & Co; JP Morgan; default data as of 31 December 2025
Our emerging market corporate debt strategy is one way to gain exposure to the asset class. It aims to deliver attractive, risk-adjusted returns. The high-income generation provides visibility on returns and helps serve as a volatility buffer.
The fund's three-year anniversary falls on 17 February 2026. To the end of January 2026, the cumulative net return has been 22.7 per cent or 7.2 per cent on an annualised basis. The returns were achieved with an annualised volatility of 3.1 per cent.
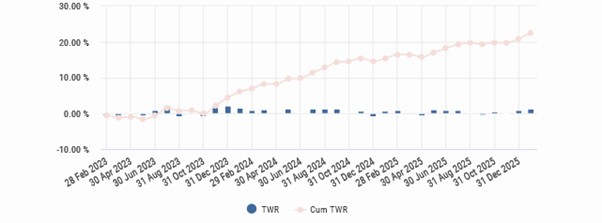
Source: J Stern & Co, 31 December 2025
Today, the strategy has an income yield of 7.8 per cent and a yield to maturity of 8.3 per cent, with a duration of 2.4 years. This provides a good indicator for the expected returns over the coming years.