Asset Management
Inflation: Roller-Coaster Or Rocket Ship?

The word "inflation" is on everyone's lips, with a sharp rise stirring reactions in the UK this week. But how fleeting are these price pressures, and how concerned should investors be? Wells Fargo's multi-asset head casts a longer view over expectations for the next 12 to 18 months.
After a sharp rise in the UK CPI this week to 3.2 per cent and the US consumer price index still edging up, questions are being raised about how soon central banks will start to taper. Matthias Scheiber, global head of multi-asset solutions at Wells Fargo Asset Management looks at the factors driving the inflationary environment over the next 12 to 18 months for investors wanting to "plot a prudent course." We welcome this analysis, where the usual editorial disclaimers apply. Email comments to tom.burroughes@wealthbriefing.com and jackie.bennion@clearviewpublishing.com
The word “inflation” seems to be in the air these days. Prices for lumber, food, used cars, gas—you name it—are all up significantly over the past year. Companies are complaining about sky-high shipping rates, semiconductor shortages, and the difficulty of filling open positions at any wage. Perhaps the biggest question on the minds of investors now is whether these price pressures are fleeting in nature or more permanent.
Our analysis points to a reflationary upward swing in economic growth and inflation expectations following the pandemic, which is creating a transitory inflationary environment that will play out over the next 12 to 18 months.
Policy responses are a big part of what is driving price pressures. It is informative to look back at the last major policy responses following the global financial crisis (GFC) for precedent. We begin our analysis by highlighting some important differences with today’s environment. Another point of reference is the market’s view—how do our expectations differ?
Also, what are some of the factors that will inform the evolution of our views? We can summarize the main factors here: The market’s confidence in central banks’ ability to manage inflation expectations; corporations’ ability to manage bottlenecks and pass-through costs to their customers, the impact of debt dynamics and savings; and how productivity improvements may be able to absorb inflationary pressures.
This is by no means an exhaustive list. However, we think this is important groundwork to lay to inform investors how to plot a prudent course in asset allocation and to spot opportunities in various capital assets on a go-forward basis.
How did the policy response to the COVID-19 crisis
compare with the response to the GFC?
The monetary and fiscal impulse has been enormous during the past
18 months. The Federal Reserve’s massive asset purchases have
ballooned its balance sheet and relief and stimulus programs have
ballooned the federal government’s debt. The last time the Fed’s
balance sheet and the federal debt grew at this pace or faster
was in the wake of the GFC of 2008 to 2009. Back then, short-term
government securities' yields dropped to 0 per cent and, in some
cases such as in the eurozone and Japan, yields eventually
dropped below 0 per cent.
The response to the COVID-19 crisis has differed in terms of the timing, scale, and focus of fiscal policy. Policymakers were very fast in responding to the COVID-19 crisis compared with how long it took to roll out fiscal support during the GFC. Figure 1 shows the difference in the scale of the stimulus—the COVID-19 crisis commanded a combined fiscal and monetary response of 20 per cent of gross domestic product (GDP) in the eurozone, 27 per cent in the US, and up to 54 per cent in Japan. For comparison, this dwarfed the fiscal support during the GFC, which ranged from a “mere” 1 per cent to 6 per cent of GDP across these regions.
.jpg)
The focus of stimulus has also been different. During the GFC, most of the fiscal support went to financial institutions. Arguably, the need to nurse financial institutions back to health made the recovery from the GFC weaker and enabled deflationary pressures. One school of thought is that monetary policy affects inflation via credit channels. The need to recapitalize financial institutions meant that monetary policy in the wake of the GFC was unlikely to be inflationary.
During the COVID-19 crisis, most of the stimulus has gone to households. The COVID-19 crisis was very different in that financial institutions were comparatively healthy at the start of the pandemic. Instead of needing to rebuild banks, monetary authorities could use banks to help channel credit to sectors that needed it most. The outsized nature of the monetary and fiscal impulse deployed during the COVID-19 crisis and the fact that this response was used in a health crisis and not a financial crisis - has summoned investors’ inflation fears.
These fears have been fed by how the US dollar has depreciated, by how real yields have fallen deeply negative, and by how the US current account and budget deficits were negative and have gotten worse.
What does the market think?
Markets process vast amounts of information, and it is generally
a good idea to start with the collective wisdom of the markets in
forming one’s own views. Then we can determine if there is
something from the market narrative that is missing or distorted
to determine whether we have an empirically based reason to have
a difference of opinion.
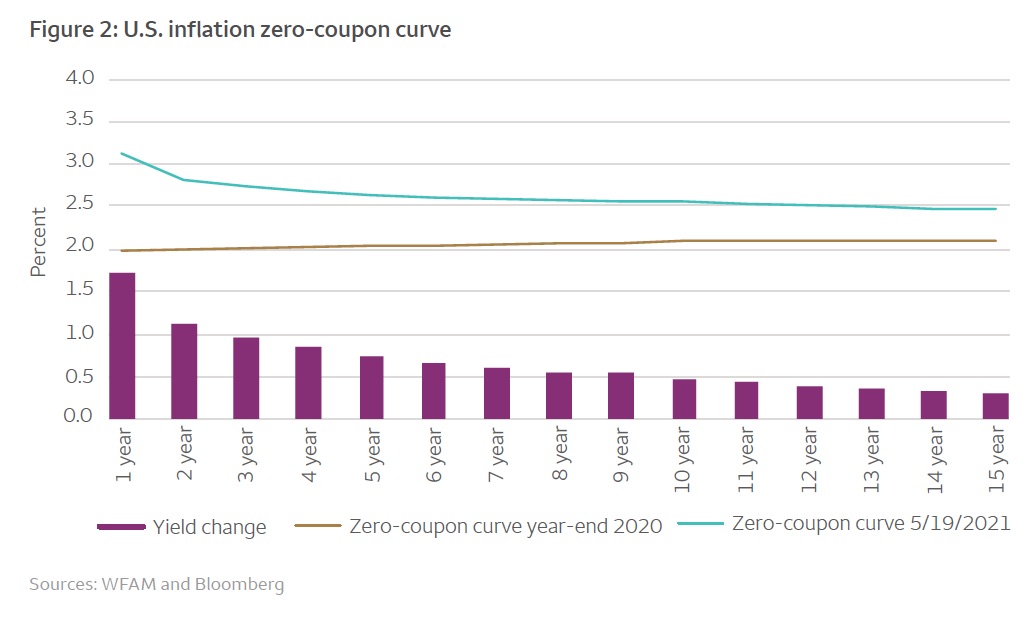
Market expectations around inflation are embedded in the inflation forward curve. Figure 2 compares the inflation zero coupon curve in the US at the end of 2020 with mid-May 2021.
As can be seen, the front end of the forward curve has reacted much more sharply than the back end of the curve. This was driven by recovering growth expectations, a weaker US dollar, short-term supply constraints, and stronger commodity prices. Similar to major central banks’ views, markets are pricing a transitory increase in inflation while the longer-term structural view on inflation is well contained. Front-end inflation expectations are back to the 2010 to 2012 highs while the long end is still 50 basis points below post-GFC levels. Hence, we see a scenario of reflation that signals inflation should be accompanied by plenty of growth.

But what about ballooning balance sheets and
debts?
Restarting an economy should be accompanied by a lot of growth
and price pressure. But will large central bank balance sheets
and federal debt make the inflationary pressure persist for
multiple years? They don’t have to. As the situation in Japan has
shown, there could be the risk of deflation or disinflation
(below target inflation) longer term.
Despite big fiscal and monetary stimulus, Japanese real rates have stopped falling since 2014, which has made it more difficult for Japan to shoulder its debt burden. Any direct comparison is difficult, yet we can see early signs of similar dynamics in the eurozone. Globally, lower inflation has been a trend over the past 20 years and we will need to wait to assess if the latest round of fiscal and monetary stimulus manages to turn the tide for longer-term inflation expectations. In other words, there must be something else added to the mix to make inflation persist. What is missing now?
Confidence
Monetary policy and fiscal policy do not, mechanically, cause
inflation. Rather, longer-term inflation is more about faltering
confidence—an ingredient that is missing today. Low inflation
expectations beget low inflation and high inflation expectations
beget high inflation. These are determined by the public’s belief
that monetary policymakers are credibly committed to their
objective of keeping inflation contained. Monitoring breakevens
and the health of Treasury auctions will help guide our thinking
about whether investor confidence is getting shaky.
Price pass-through and bottlenecks
There are also a few other factors at play in determining the
direction of inflation. Higher producer prices can precede higher
consumer price inflation. The first line of defense against
higher consumer prices is profit margins. Companies may
temporarily be able to pass input cost pressures on to consumers,
but after accumulated excess savings have been depleted, the
forces of global competition are likely to curtail businesses’
ability to enjoy 100 per cent inflation pass-through to
consumers; margins will be squeezed instead.
Over the past year, the Producer Price Index has increased more than 5 per cent, but we think cost pressures will abate as supply shortages and shipping costs normalize. Freight rates and the various purchasing manager surveys of supplier delivery times should help trace out whether bottlenecks are getting better or worse.
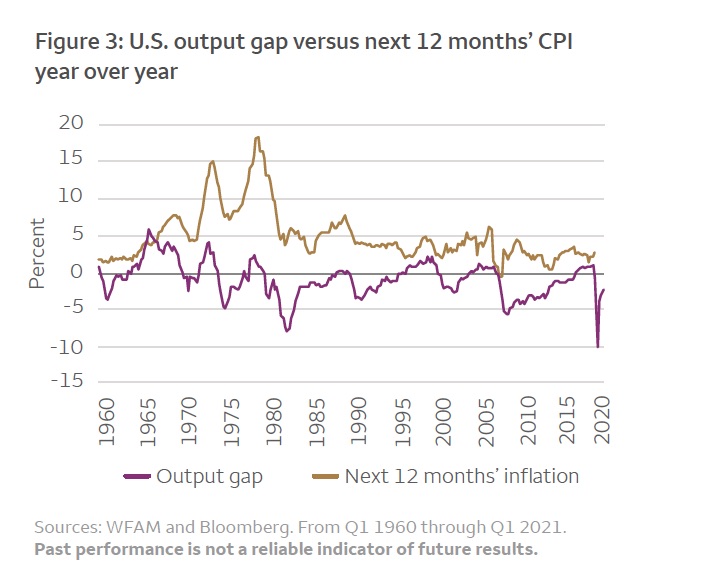
Some economists point to a large output gap as a reason to be sanguine about inflation. The output gap compares what the economy is currently producing versus its potential if all factors of production (land, labor, and capital) are fully employed. The theory is that when the output gap turns positive, the economy is producing above long-term potential and inflationary pressures mount.
When the output gap is negative, as it is currently, there is slack and little inflationary pressure. Figure 3 shows the empirical relationship between the output gap, as calculated by the Congressional Budget Office, and inflation over the next four quarters. While there is a positive relationship between the two, it is not a very strong relationship (the correlation coefficient is only 0.14). However, excess capacity, as demonstrated by the negative output gap, is something we would expect to shrink before inflation makes a permanent move higher.

Debt dynamics
Milton Friedman famously said that inflation is always and
everywhere a monetary phenomenon. That dictum needs to be updated
for today when most transactions are done electronically or on
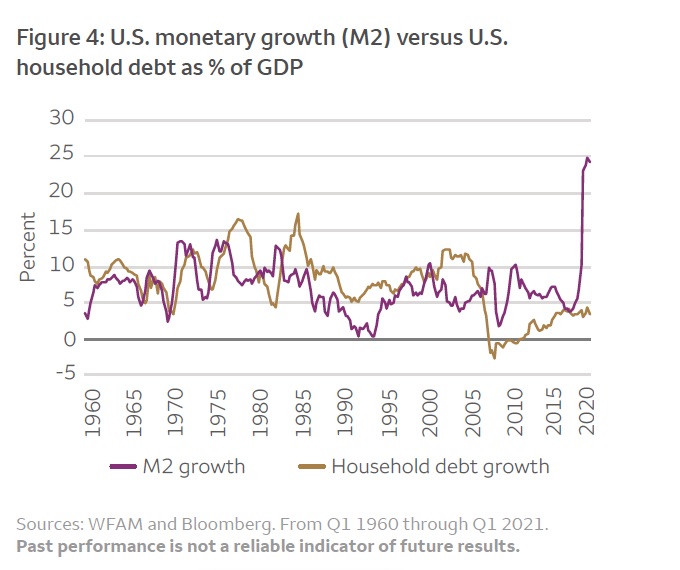
credit. More properly, inflation is partially a credit
phenomenon. While the federal government has been increasing its
debt as a percentage of GDP, household debt growth has been below
average, as shown in Figure 4. In fact, with excess savings from
stimulus checks, households have improved their overall credit
profile. Debt accumulation by households could pick up, so we
will be monitoring bank lending and consumer credit data closely.

Productivity
Faster productivity growth, which is the ability to produce more
with a given quantity of inputs, is positively correlated to
lower inflationary pressures. Productivity growth was very low
after the GFC. During the COVID-19 crisis, we likely had a few
years’ worth of technology adoption crammed into a few months due
to forced technology adoption and quick changes in consumer and
business behaviors as people adapted to a stay-at-home and
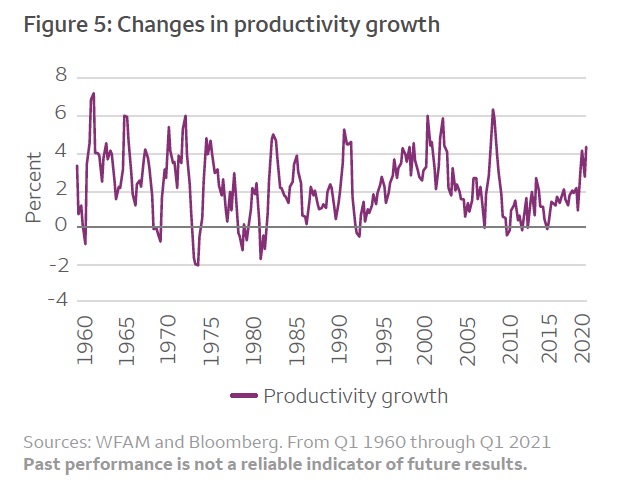
work-from-home world. Relatively high productivity growth, as
shown in Figure 5, contributes to our view that inflation should
be elevated for only the next 12 to 18 months before bottlenecks
clear.

In this case, the input to watch is labor. To the extent that we can see the number of people unemployed drop quickly, there are possibly years of productivity benefits to be harvested. That could mean faster growth against a backdrop of strong profit margins with inflation migrating back to central banks’ targets.
What should investors think about now?
As multi-asset investors, our research has shown that a strategic
allocation to what we call “inflation assets” can improve the
expected risk-return behavior of a diversified portfolio. Most
investors can benefit by maintaining a strategic allocation over
a business cycle, congruent with their unique long-run return
objectives and risk tolerance.
While our research suggests that heightened inflationary pressures should decline within the next 12 to 18 months, we think that investors can make tactical moves to harness near-term shifts in sentiment. The latest transition from a rapid COVID-19 recovery that benefited growth assets has shifted toward a rally in inflation-sensitive assets. That dynamic occurs when the market is changing its focus from early recovery to a mid-cycle stage of the economic cycle. In this environment, we prefer assets whose cash flows adjust upwards with inflation or whose valuations improve relative to other assets when there is inflation. Using this lens, the following assets may benefit through what we believe is a reflation (growth plus a temporary increase in inflation) cycle:
-- TIPS: though short-term maturity with lower real interest rate
sensitivity;
-- Commodities: energy and precious metals tend to do well;
-- Spread products such as high yield, corporate bonds, or loans:
which have lower interest rate sensitivity than long-duration
government bonds and an additional spread component as a return
buffer against higher rates;
-- Equities: particularly the lower-duration part of the equity
market (cyclical and value oriented) and emerging market
equities; and
-- Alternative strategies: trend following, carry and value tend
to do well during a reflation cycle
There are clearly risks to the inflation outlook. In this note, we discussed a few key variables we are watching that are shaping our views. We also offered some insight into our approach to tactical positioning in this environment. Above all, a key insight we hope that readers take away from this discussion is that the outlook for inflation, or any systemic risk for that matter, is dynamic and evolving. An informed view must remain adaptive. To this end, we hope we’ve provided some useful tools herein for refining your own outlook.